BLOG

Embracing Innovation & Growth in the Optical Industry with William Dickerson
In this episode of the Mayhem to Mastery: Leading Transformation from the Middle, James Thompson and Ronii Bartles speak with William Dickerson, Director of Quality Management Systems at EssilorLuxottica Rx Operations, North America. EssilorLuxottica is a global leader in the design, manufacture and distribution of advanced vision care products, eyewear and med-tech solutions. Their mission is to help people around the world to see more and be more by addressing their evolving vision needs, personal style aspirations and desire to feel more connected to the world around them.

Leading with Empathy & Decisiveness with Larry White
In this episode of the Mayhem to Mastery: Leading Transformation from the Middle, James Thompson and Ronii Bartles speak with Larry White, retired vice president of Smithers-Oasis Company and Temprecision International. Smithers-Oasis is a diverse global manufacturer and marketer of floral foam and design media, floral accessories, postharvest products, cellular growing media, temperature control packaging, medical impression foam, and custom foams for specialized applications. Temprecision International provides science-driven solutions for temperature-controlled shipping applications.

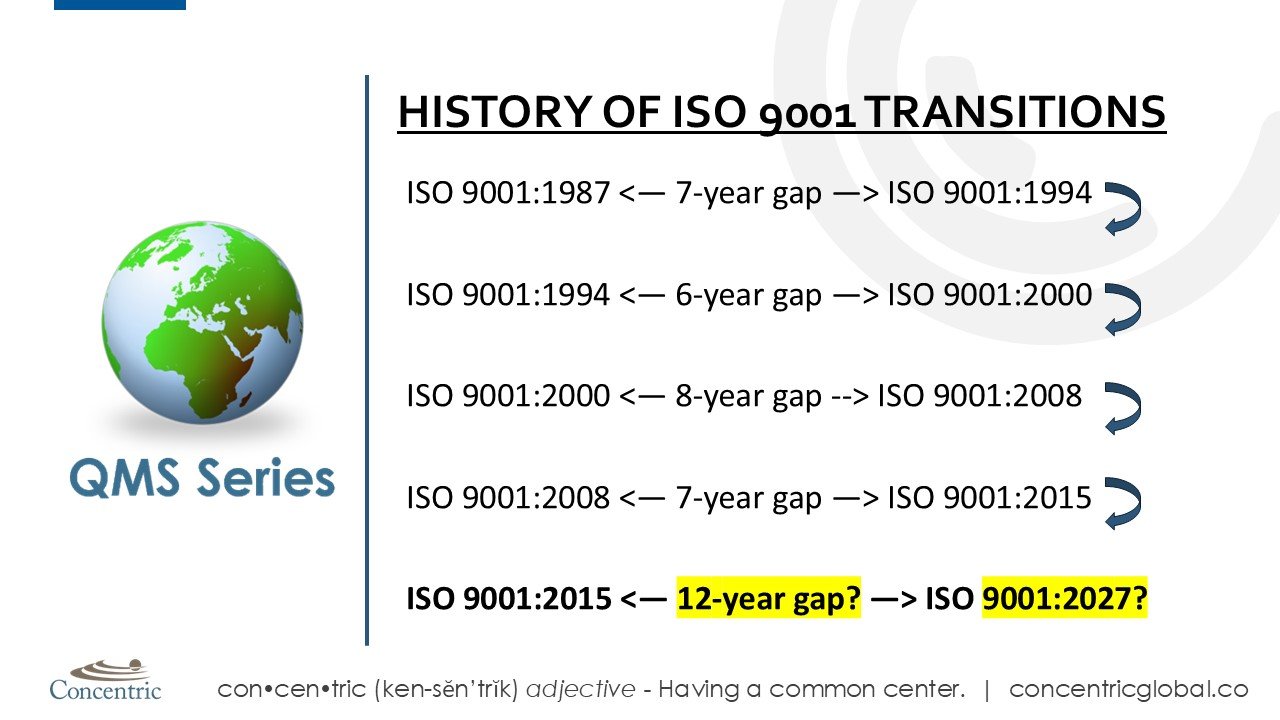
Podcast: Predicting the Key Changes to ISO 9001
In this video, industry expert James R. Thompson breaks down the most likely changes we can expect in the next revision of ISO 9001. With extensive experience in quality management, digital transformation, and global compliance, James offers a practical, forward-looking perspective to help organizations prepare early.

Part II: Alignment in Action - Case Studies That Moved the Needle
If alignment is the multiplier, what does it look like in practice? Here are three examples where Concentric Global helped leadership teams turn mayhem into mastery, with results investors care about.

Navigating Operational Trauma & Change with Vince Lombardy
In this episode of the Mayhem to Mastery: Leading Transformation from the Middle, James Thompson and Ronii Bartles speak with Vince Lombardy, Senior Manufacturing & Operations Leader, Vice President of Transloading at Harbor Logistics, which provides transportation, truck/rail transload, and warehousing services in Charleston to diverse industrial and commercial counterparties.

Turning Chaos Into Opportunity with Consumer Products Industry Veteran & Angel Investor, Tom Browning
In this episode of the Mayhem to Mastery: Leading Transformation from the Middle, James Thompson and Ronii Bartles speak with Tom Browning, who, after an extensive tenure in the beverage industry, has turned his attention to investing in and mentoring early-stage companies with big growth potential. He is a member of Queen City Angels, one of the largest angel investing groups in North America, a partner at H Venture Partners, which focuses on women-led consumer startups, and an active investor with VentureSouth in Charleston. He also gives back by serving as lead mentor at The Harbor Entrepreneur Center in Mount Pleasant, helping founders chart their own paths.

Part I: Alignment - The Hidden Multiplier of Enterprise Value
Misalignment doesn’t show up as a neat line item in the P&L. It hides in the between the couch cushions:
Conflicting priorities: Sales chases growth at any cost while operations quietly trims expenses.
Decision gridlock: Leadership debates endlessly, burning months without decisive action.
Talent drain: Top performers leave because no one can explain where the company is headed or why their role matters.
Value leakage: Every month wasted in misalignment is a month of EBITDA not realized at its full potential.

Understanding Personal & Organizational Transformation with Dr. Leah Jackman-Wheitner
In this inaugural episode of Mayhem to Mastery: Leading Transformation from the Middle, James Thompson and Ronii Bartles speak with life coach, Dr. Leah Jackman-Wheitner.

ISO 9001:2026 – The Road to the Next Edition
Our infographic Chronology of ISO 9001 Updates shows the full picture of the evolution of this quality management system standard over the past 40 years and what to expect next.


The Ultimate Guide to Knowledge Management: 10 Strategies to Capture Tribal Knowledge
Learn how to capture and share critical tribal knowledge with 10 proven strategies to strengthen your organization’s collective intelligence and resilience.


Comparing Business Management Systems and the Human Body
Comparing a business management system (BMS) to the systems in the human body is a great way to bring some clarity to an otherwise confusing concept. The BMS vs. Body analogy also highlights how essential coordination and specialization are for effective operation. Here are a few ways to compare the two systems that may help you better promote a systemic approach in your organization.

What Is A Business Management Systems?
Think of a business management system (BMS) as the body of how an organization operates, aligns with customer needs, provides value, grows and changes. It’s not just one thing - it’s a carefully orchestrated mix of processes, people, policies, and information designed to meet your company’s goals, while adapting to an ever-changing world.

Bring Training & Certification In-House
We've been cooking up something really awesome in 2024! Did you know you could be scaling your training and employee development dollars 10x+ by bringing mobile-friendly certification courses in-house? Meet your workforce development where they are - on their mobile phones and tablets. Send us a text if you want to learn more.