
Introducing the Super Turtle Diagram
As if the concepts of a Turtle diagram, the SIPOC diagram or the TU-POC diagram weren’t strange enough, we’re excited to introduce you to our latest tool in the world of process visualization - the “Super Turtle Diagram”. You can consider this our Turtle Diagram 3.0 if you’ve been following our turtle diagram series. #nerdsrule
For decades now, the turtle diagram has been one of my favorite process improvement tools. It is simple, easy to explain and is sticky (easy to remember). While there is debate over the origins of the turtle diagram, we tend to see if used mostly in the automotive manufacturing sector. There is no mention of turtle diagram in any of the dozens of standards or guidance documents, yet it is used by a growing number of industry leaders.
The evolution of the turtle

The illustration above shows the evolution of how we’ve used various 1-page visualization tools over the past 20+ years to document how a process flows between various stakeholders. One of my favorite 1-page process flow diagram tools was the swimlane diagram, dating back to my college years at Purdue University in the early 1990s. The swimlane is a great tool but it lacks the listing of key resources that are needed to make the process deliver it’s intended output.

The other 1-page tools I used were the turtle diagram and the SIPOC diagram. Both were great at defining key elements of a single process. However, I liked the layout and clear classification of necessary resources that was baked into the turtle diagram. The more I used the turtle diagram, the more I started to see it as an inverted Ishikawa diagram (“Fishbone diagram”) or what we called the “reverse fishbone”.

If the fishbone diagram is a welcomed tool for identifying cause and effect relationships for, say, bad donuts getting out to the customer, why can’t we reverse-engineer an optimal process design? The fishbone diagram is actually a reverse engineering technique, therefore what we need is a schematic that represents the elements needed to produce a desired result. If we use a pro-active process engineering technique that combines elements of both the turtle diagram and the SIPOC diagram… well… that’s where the “TU-POC Diagram” came in. Note: This was a fun play on words and a nod to the late, great Tupac Shakur; a name rarely connected to OpEx and CI.
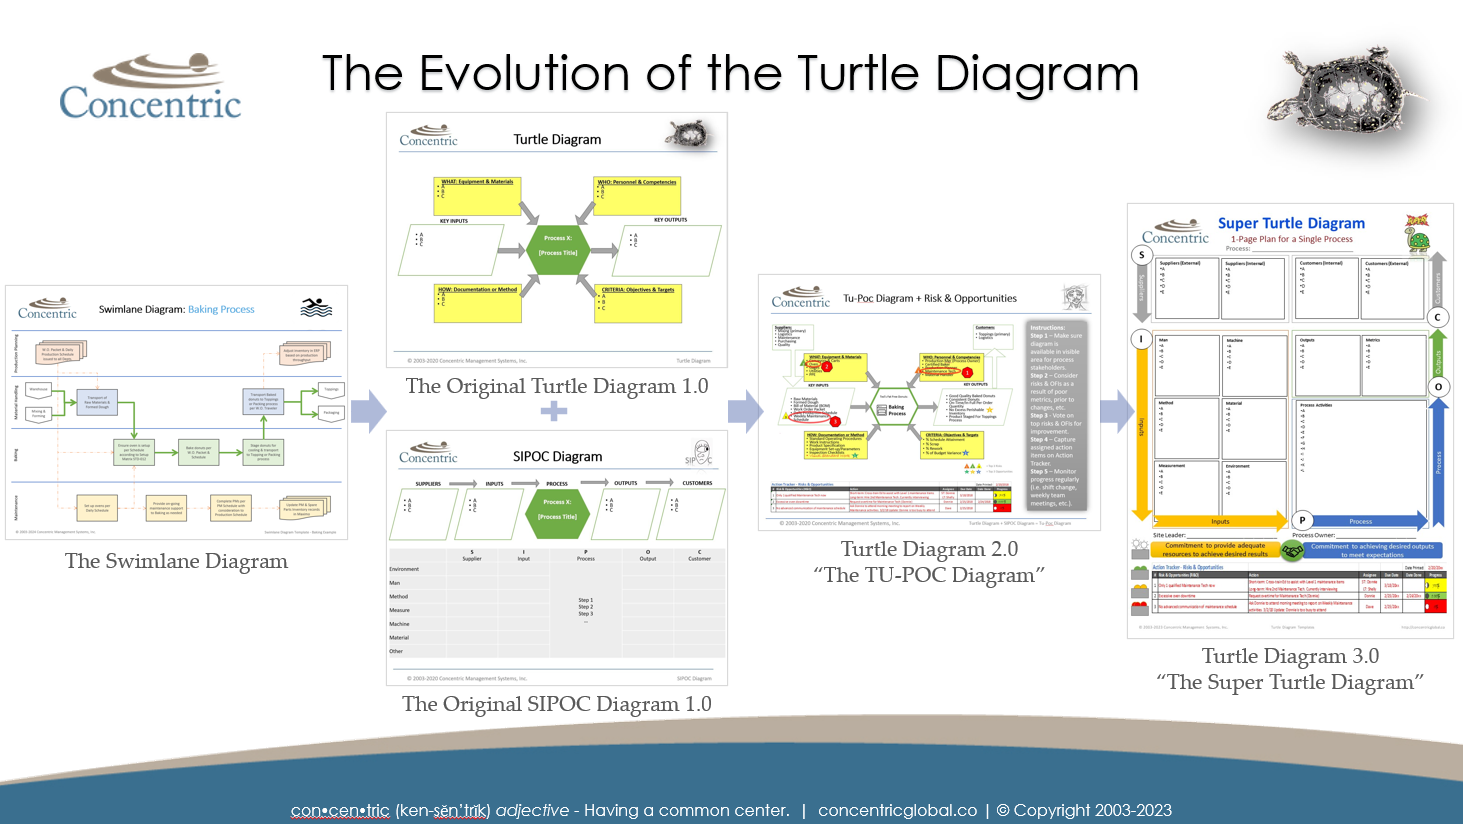
The evolution of the Swimlane Diagram > original Turtle Diagram + SIPOC Diagram > Tu=Poc Diagram > Super Turtle Diagram
What’s the difference between the Super Turtle Diagram and previous versions?
While the Turtle Diagram is a process improvement tool (schematic visual representation) of the key elements that make up a single process, the Super Turtle Diagram places emphasis on the importance of the agreement between the process owner and the site leader. This improved version ultimately “breaks the field in half”, in turn illustrating what is required on both sides of the field to drive optimal results. This vantage point towards process optimization is also call the “3P state” or “process at peak performance”. More on that in future blogs.

The Super Turtle Diagram focuses on “The Handshake” agreement between the Process Owner and Site Leader
The right side of the field
The process owner and team - typically cross-functional - are expected to achieve specific results. That’s a given; albeit those results are not always well stated or unmeasurable. When evaluating the health - process effectiveness x process efficiency x process capability - we tend to focus on process outputs or the right side of the field.
Auditors, supervisors and inspectors tend to evaluate at a deeper level by evaluating process activities that directly transform inputs into outputs. From my experience, rarely do we treat the necessary inputs and their suppliers with the same scrutiny. But why? I’ll tell you why. We tend to pay more attention to those elements of the world that are easiest to see. Just because something is easier to see (detect) doesn’t mean it occurs (occurrence) more frequently. Did someone say FMEA?
The process owner is expected to achieve stated results. However, the site leader that must provide the resources necessary for achieving these results or adjust expectations.
The Left side of the field
In the majority of the process breakdowns we’ve worked with client on (i.e. problem solving, Six Sigma, lean, root cause analysis, new process design), the site leadership has high expectations of the process team while falling flat on providing the resources necessary for achieving these results or ever-changing expectations. Site leadership is quick to support a sudden spike in sales, which results in higher expectations on the right side (output) of the Super Turtle Diagram field. However, the scales are now imbalanced. Leadership must allocate or reallocate additional resources to the left side of the diagram to meet the new expectations. This is where a process, and subsequently overall organizational performance, fails the most.
One of the most valuable elements in using the Super Turtle Diagram is the visibility that the process stakeholders have of the left side (input) of the field.
So What’s Next?
Due to the popularity in all things turtle, we’ve decided to expand our blogs and other free content over the next year or so. Future blogs in this series will explore:
detailed instructions on how the Super Turtle Diagram works;
how you can purchase pre-populated diagrams featuring key elements of the 20 most popular processes in business;
facilitator bundles for managing workshops on your own;
how you can hire us to facilitate intensive workshops (remotely or onsite) for your team
Ready to get started? Download the editable bundle including the Swimlane Diagram, the Turtle Diagram, the SIPOC Diagram, the Tu-Poc Diagram, the new Super Turtle Diagram and more.